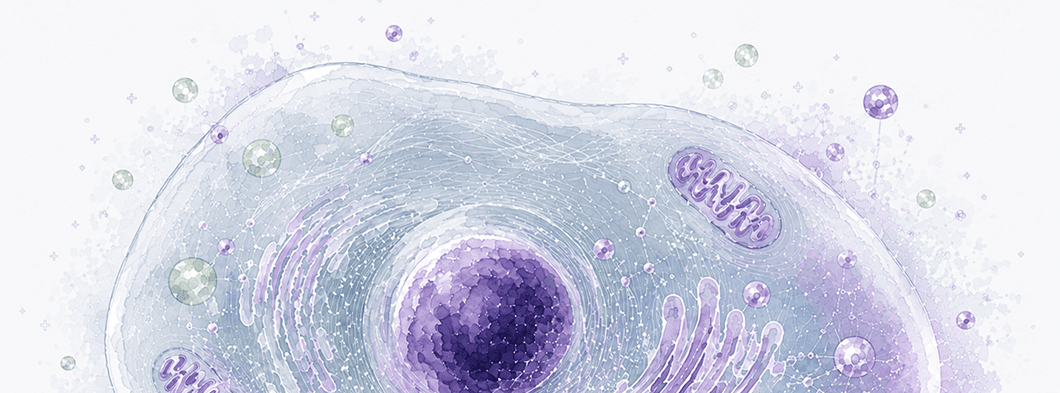
Reveal Hidden Electrostatic
Landscapes in Living Systems
ChargeViewer reveals invisible electrostatic patterns in living systems — turning physical insights into breakthroughs in biology and medicine.
Explore TechnologySample
Biological systems in their native environment
Sensing
Nanoscale electrostatic imaging
AI Analysis
AI-powered pattern and signature analysis
Interpretation
Biological insight and mechanistic understanding
Prediction
Predict outcomes and guide better decisions
SUPPORTED BY COLLABORATIONS ACROSS ACADEMIA AND MEDICINE








ChargeViewer is a physical biology platform that measures electrostatic and biophysical signatures in living systems.
By revealing patterns invisible to conventional methods, it helps researchers understand dynamic biological states and responses.

Earlier Biological Signals
Detect physical changes before conventional endpoints reveal them.

Dynamic Response Tracking
Observe how living systems respond across time, conditions, and experimental interventions.

Better Translational Understanding
Connect physical measurements to disease mechanisms and therapeutic response.
From Living Systems
to Physical Signatures
ChargeViewer captures electrostatic and biophysical signals from living biological systems and translates them into measurable physical signatures that can reveal hidden states, responses, and disease-relevant changes.

Cells
Living cells under investigation

Tissues
Biological structures in relevant conditions

Organoids
Complex model systems for disease research

Biological Interfaces
Nano–bio and cell–environment interactions
ChargeViewer™
Nanoscale electrostatic sensing + AI-supported interpretation.
Physical Signatures
Measurable signals associated with biological state, therapeutic response, and disease progression.
How ChargeViewer Works
ChargeViewer combines biologically relevant samples,
nanoscale electrostatic sensing, AI-supported analysis, and scientific interpretation to transform physical measurements into actionable biological insight.

1. Sample
Living cells, tissues, organoids, or biological interfaces are studied under biologically relevant conditions.

2. Sensing
ChargeViewer applies ultrasensitive probes capable of imaging surface charge distributions without deforming a sample.

3. AI Analysis
AI models identify meaningful electrostatic patterns, biological relationships, and emerging signal changes.

4. Physical Signature
Transform raw measurements into interpretable physical signatures linked to biological states and dynamic responses.

5. Prediction
Use identified signatures to predict biological responses and support better research and experimental decisions.
Revealing Biological States Conventional Methods Often Miss
ChargeViewer helps researchers detect hidden physical signals that influence disease progression, therapeutic response, and dynamic biological behavior.

Surface Charge Organization
Detect how electrostatic patterns are distributed across living cell and tissue surfaces.
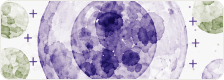

Bio-Interface Interactions
Understand how cells, tissues, nanoparticles, and biological environments physically interact.
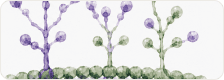

Glycocalyx Remodeling
Observe changes in the protective outer layer of cells that can influence disease behavior and response.

Dynamic Tissue Responses
Track how living tissues physically respond over time to disease, treatment, or environmental change.
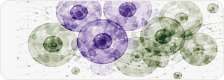
A New Charge Map of Living Biology
ChargeViewer™ maps local electrostatic inhomogeneity across living biological surfaces — revealing nanoscale patterns that change over time.










Bring Physical Biology
Into Your Research
Explore how ChargeViewer can support biological research,
therapeutic response studies, and predictive discovery.